Since October 2022, we are collaborating with the Swiss Seismological Service (SED) at ETH Zurich and sup-port the production of different sorts of earthquake occurrences and risk maps.
As a first project, led by Michèle Marti (SED), we are developing a fact-based colour representation of the new Swiss earthquake risk model as a map. The SED’s new national earthquake risk model combines detailed data on earthquake hazard, the local geological subsurface, the vulnerability of buildings, and the people and values potentially affected by an earthquake. This new model makes it possible for the first time to quantify the impacts of earthquakes in Switzerland.
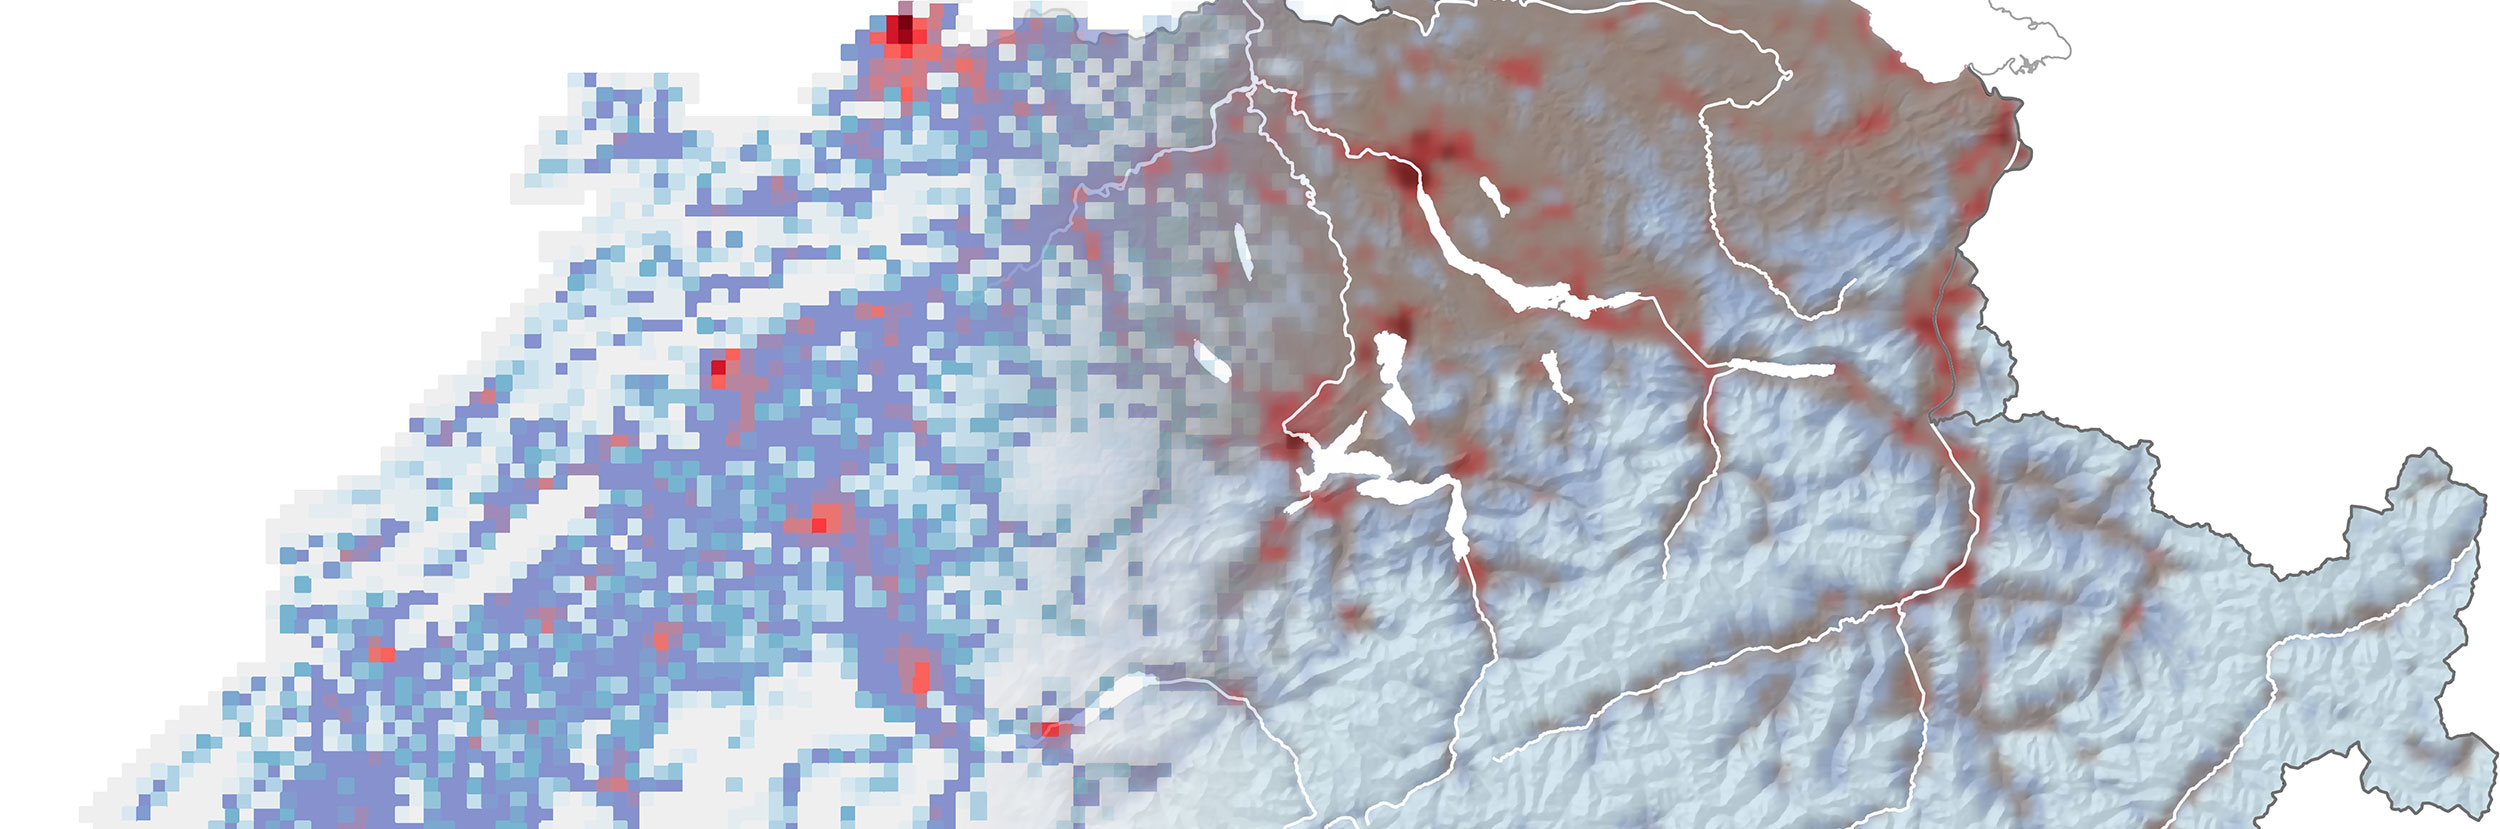
The earthquake risk map (Fig. 1) is based on an index that combines the expected number of fatalities with the estimated financial losses due to building damage. The values indicated always refer to an area of 2 x 2 kilometres. The earthquake risk is highest in the areas coloured dark red. The light-blue areas have a lower risk because there are relatively few people and assets in these locations. Nevertheless, the damage to individual buildings in these regions could be devastating as well. Therefore, an earthquake risk exists throughout Switzerland.

Further information visit the website of the Swiss Seismological Service (SED):